A buyer comparing Fort Worth neighborhoods this summer might open four browser tabs for Tanglewood and come away with four different homes in mind. One tab says the average sale price just jumped 83 percent to $2.2 million. Another says the median actually fell nearly 20 percent to $1.3 million, in the same stretch of time. A third pegs the neighborhood's typical home value at $718,068, a full million dollars below the first number. A fourth shows list prices sliding while days on market swing wildly in opposite directions depending on which site you ask.
None of these numbers is wrong. That's the part worth sitting with. Tanglewood isn't a market where the data disagrees because someone made an error. It disagrees because Tanglewood, as currently sold, is a genuinely thin market with two distinct housing stocks living under one neighborhood name, and every site slices that reality differently.
The Four Numbers, Side by Side
Here's what a buyer actually finds when comparing sources this year:
| Source | Metric | Figure | Period |
|---|---|---|---|
| Redfin | Median sale price | $1.3M, down 19.3% year over year | October 2025 |
| Redfin | Average sale price | $2.2M, up 83.3% year over year | Fall 2025 |
| Redfin | Median price per square foot | $512, up 38.4% year over year | October 2025 |
| Movoto | Median list price | $1.39M, down 1% year over year | November 2025 |
| Movoto | Median price per square foot (list) | $395, down 10% year over year | November 2025 |
| NeighborhoodScout | Median real estate price | $718,068 | Profile updated November 2025 |
Look at the spread. The average and the median moved in opposite directions in the same season. The two sites tracking square footage came up with figures nearly $120 apart. And NeighborhoodScout's number sits almost a million dollars under Redfin's. A buyer trying to budget off any single one of these would end up either badly overestimating or badly underestimating what it actually takes to close on a house here.
It Isn't an Error. It's a Thin Market.
Redfin's own data shows the mechanism plainly: only four homes sold in Tanglewood in October 2025, up from three the year before. That's the entire month's transaction count. When a neighborhood's monthly sales fit on one hand, a single high-end closing can swing the average by tens of percentage points without the underlying market actually strengthening, and a single smaller or dated home closing can crater the median without the underlying market actually softening.
This is also why days on market told two contradictory stories at once. Redfin showed homes averaging 45 days on market in October 2025, more than double the 21 days from a year earlier. Movoto, tracking a median rather than an average the following month, showed 28 days, a steep drop from the year before. Both can be true in a market this small. A couple of homes that lingered for months pull an average up sharply, while the typical home in the middle of the pack still moves fast. Average and median are answering different questions, and in a market with only a handful of transactions, that gap can look enormous.
Two Very Different Tanglewoods
The other reason the numbers scatter is that "Tanglewood" describes two distinct products, and which one happens to trade in a given month determines what the aggregate looks like.
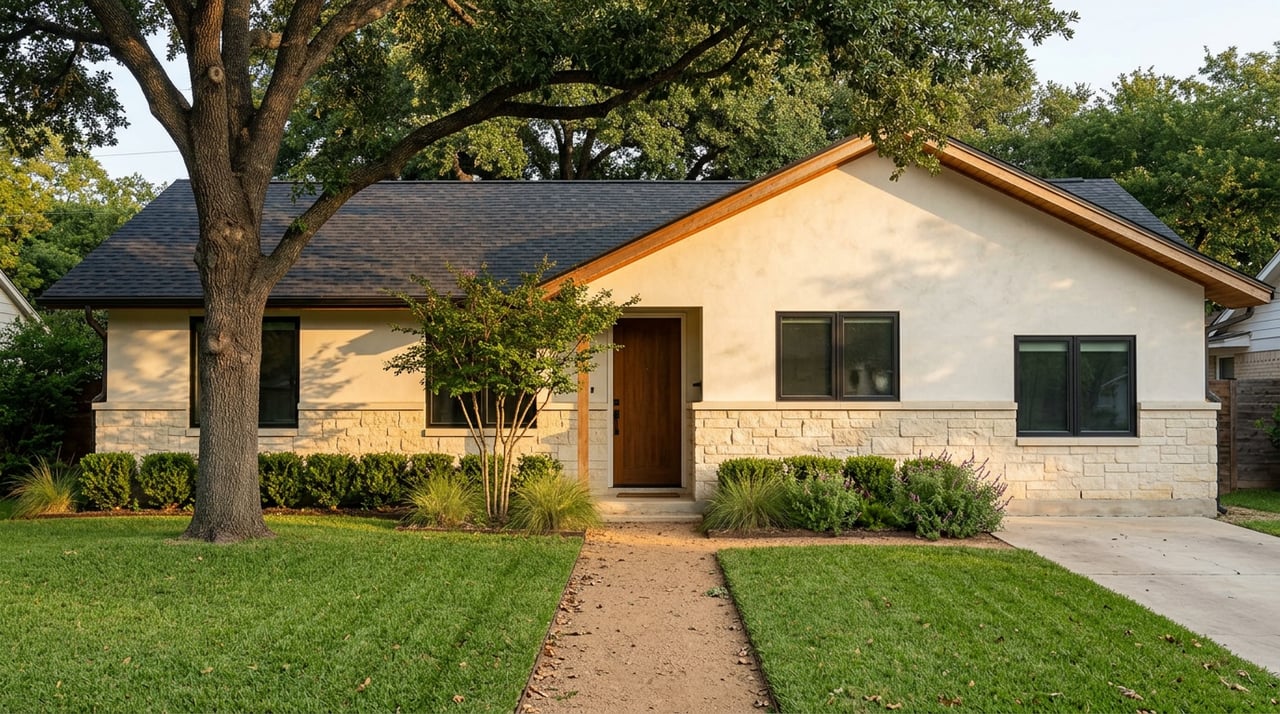
The original section of the neighborhood is built mostly from 1950s and 1960s single-story homes on parcels in the roughly two-tenths to four-tenths of an acre range. A representative example: a 1956-built, three-bedroom, two-bath home on Tanglewood Trail, 2,354 square feet on a 0.22-acre lot, recently marketed in the $950,000 range. A block over, a similar-era home at 3124 Tanglewood Trail, fully renovated down to the studs with new plumbing, electrical, HVAC, and a 2023 roof, closed this February for an estimated $947,000 to $1,082,000 after listing at $1,150,000.
Then there's the newer or larger-footprint pocket, concentrated around Overton Park, where homes run considerably bigger on considerably bigger lots. Recent active listings there include a four-bedroom, four-bath home on Harlanwood Drive at 3,396 square feet on a 0.3-acre lot asking $1.395 million, a five-bedroom on Glenwood Drive at 2,977 square feet asking $1.299 million, and a six-bedroom, six-bath house on Summercrest Court spanning 6,195 square feet on a 0.43-acre lot at $1.45 million.
Put those two buckets side by side and the math writes itself. If two Overton Park-scale homes close in the same month as two original-section homes, the average gets dragged toward $1.3 to $1.5 million territory while the smaller comps anchor the median much lower. If the month's activity happens to skew toward the original section, the reverse happens. With only three or four closings recorded per month, the mix isn't a statistical detail. It's the whole story.
Why NeighborhoodScout's Number Looks So Different
NeighborhoodScout's $718,068 median deserves its own explanation, because it isn't measuring the same thing as Redfin or Movoto. NeighborhoodScout's own description of the area notes that Tanglewood's housing stock includes small apartment complexes and high-rise units alongside single-family homes, and that the neighborhood mixes owners and renters. A median built from that broader mix, condos and rental units included, will land well below a median built strictly from recent single-family sales. Both figures are accurate descriptions of Tanglewood. They're just describing different slices of it.
What This Means for a Comparison Shopper
For a buyer using Tanglewood as one data point while comparing Fort Worth's higher-end pockets, the practical takeaway isn't to find the one correct number. It's to stop trusting any headline figure from a market this size and ask two questions instead: which Tanglewood is this data describing, the original section or the larger-lot pocket, and is this a list price, a sold price, an average, or a median. Those four variables explain nearly all of the spread above.
It's also worth building in the due diligence question that comes with buying into the older section specifically. Much of North Texas, Tanglewood included, sits on expansive clay soil, often called black gumbo, that swells when saturated and shrinks during dry stretches, and mature trees close to a foundation intensify that cycle by pulling moisture unevenly from the soil around a slab. A 1950s or 1960s home with decades of settling history is a different diligence project than a home built or substantially rebuilt in the last few years, and a buyer weighing the two Tanglewood price bands should weigh that difference alongside square footage and lot size, not just the sale price.
A Few Questions Worth Asking Before You Compare Numbers Across Neighborhoods
If Tanglewood's numbers are this inconsistent, is the neighborhood actually appreciating or not? The honest answer is that a market moving three or four sales a month doesn't generate a reliable monthly trend line in either direction. Multi-quarter patterns, and a close look at comparable homes rather than the aggregate, tell you more than any single month's average or median.
Does this same thin-market effect show up in other Fort Worth luxury neighborhoods? Any neighborhood with a low monthly transaction count is vulnerable to the same swings. The fix is the same everywhere: ask what's actually included in the number before treating it as representative.
Should I just ignore the aggregated numbers entirely? Not entirely. They're useful for spotting that a market is thin and bifurcated, which is itself valuable information. They're just the wrong tool for pricing a specific home.
Comparing neighborhoods on price alone, especially in a market this size, tells you less than it appears to. If you're weighing Tanglewood against Mira Vista, the Cultural District, or another Fort Worth enclave and want someone to walk through the actual comps rather than the headline averages, Willoughby Agency can put the real numbers in front of you and help you read them correctly. Schedule a private consultation to start.